DMD Analysis
Open from ‘3. Analysis DMD Analysis‘.
Dynamic Mode Decomposition (DMD) extracts spatial modes that oscillate at a single frequency and grow or decay at a single rate. Unlike POD, DMD modes are not ordered by energy but by their dynamic content. This makes DMD ideal for isolating periodic phenomena such as vortex shedding, acoustic resonances, or shear layer flapping (Schmid, 2010; Tu et al., 2014).
References: Schmid, P.J. (2010). Dynamic mode decomposition of numerical and experimental data. Journal of Fluid Mechanics, 656, 5–28. Tu, J.H., Rowley, C.W., Luchtenburg, D.M., Brunton, S.L. & Kutz, J.N. (2014). On dynamic mode decomposition: theory and applications. Journal of Computational Dynamics, 1(2), 391–421.
Computing DMD
Spectrum tab
The spectrum shows each DMD mode as a bubble in the frequency-growth-rate plane, with bubble area proportional to mode amplitude. Click on any bubble to display its spatial structure in the Mode tab. A growth-rate filter threshold can be applied to focus on near-neutral physically meaningful modes.
Mode tab
Displays the spatial structure (real and imaginary parts) of the currently selected DMD mode for the chosen velocity component.
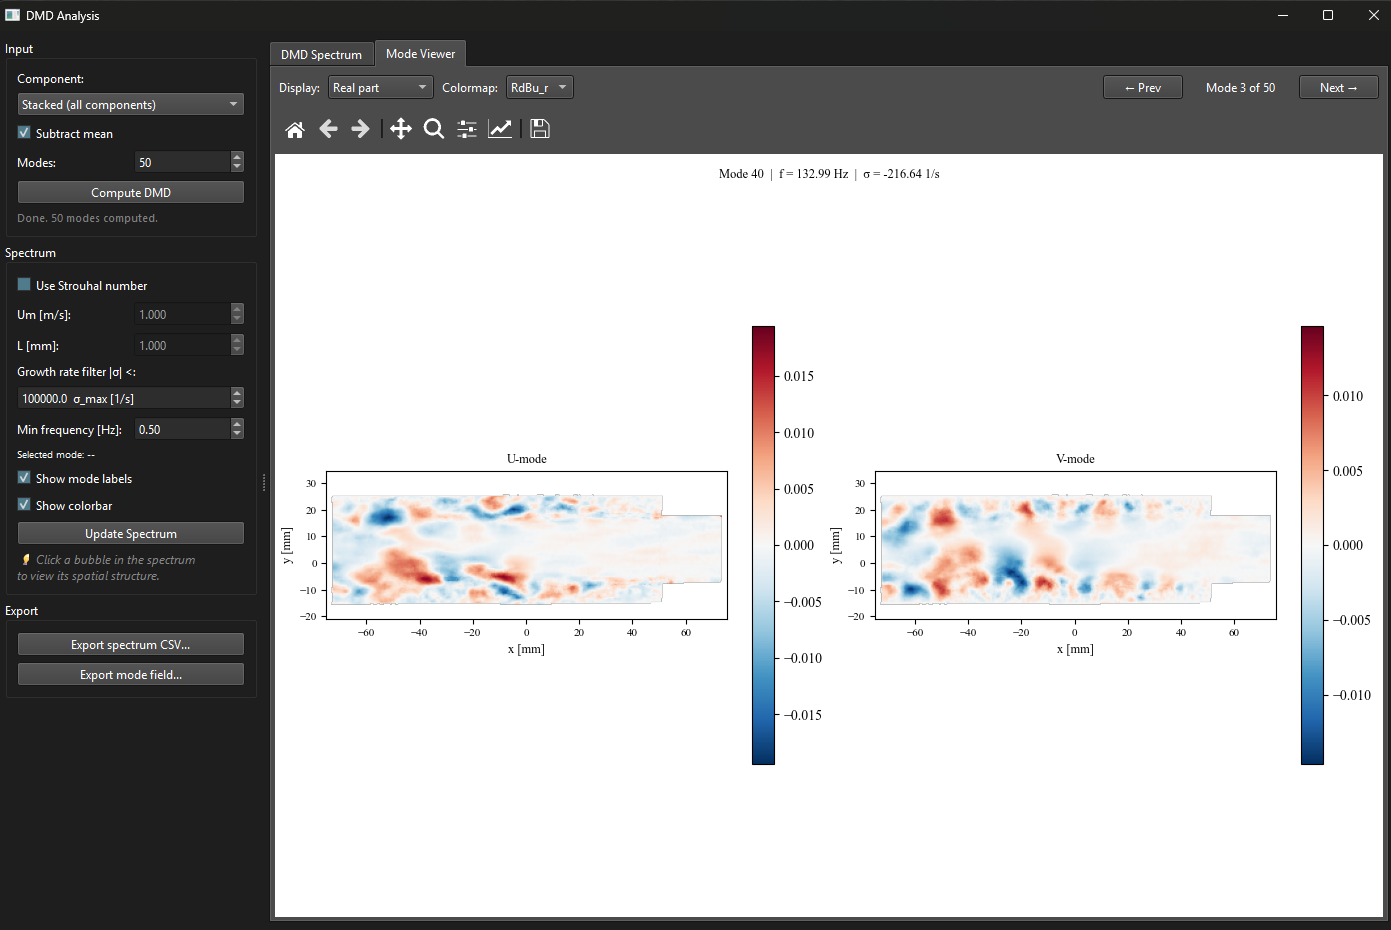
Figure 1:DMD Mode tab showing the real and imaginary parts of a selected mode. Animating between them gives a sense of the structure’s oscillation in time.
Exporting
Click ‘Export spectrum CSV…‘ to save a table of all modes with their frequency, growth rate, and amplitude. Click ‘Export mode field…‘ to save the spatial structure of the currently selected mode as a Tecplot .dat file.